Errorbars
Error bars are a simply addition to your graph, utilising their own geometric command geom_errorbar().
To add the error bars, we use the following command
ggplot(weeds.summarise, aes(x=species, y=mean)) +
  geom_bar(stat="identity")+
  geom_errorbar(aes(ymin = mean-se, ymax = mean+se))
This is suprisingly simple. All we do is specify the aesthetic (aes) where we compute our minimum and maximum y values for our bars as our mean column +/- our standard error column.
We can further customise our errorbars through the use of a few arguments. Lets explore those iteratively.
Size
ggplot(weeds.summarise, aes(x=species, y=mean)) +
  geom_bar(stat="identity")+
  geom_errorbar(aes(ymin = mean-se, ymax = mean+se), size = 2)
The size argument increases the thickness of the errorbars
Colour, linetype and transparency
We can also change the colour, linetype, and transparency.
ggplot(weeds.summarise, aes(x=species, y=mean)) +
  geom_bar(stat="identity")+
  geom_errorbar(aes(ymin = mean-se, ymax = mean+se), colour = "red")
Colour is as straightforward as usual, just name a colour.
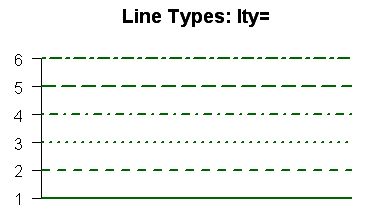
For linetype, we specify a number between 1-6 that corresponds to R’s built in linetypes.

ggplot(weeds.summarise, aes(x=species, y=mean)) +
  geom_bar(stat="identity")+
  geom_errorbar(aes(ymin = mean-se, ymax = mean+se), colour = "red", linetype = 2)
Transparency is specified throught the alpha argument, giving a number between 0 (transparent) and 1 (solid). It’s pretty pointless for errorbars, but it can be used for many other functions.
ggplot(weeds.summarise, aes(x=species, y=mean)) +
  geom_bar(stat="identity")+
  geom_errorbar(aes(ymin = mean-se, ymax = mean+se), size = 2, alpha = 0.5)
Width
The width argument is arguably the most important aesthetical customisation for errorbars. Width customises the width of the errorbars compared to the width of the bars.
ggplot(weeds.summarise, aes(x=species, y=mean)) +
  geom_bar(stat="identity")+
  geom_errorbar(aes(ymin = mean-se, ymax = mean+se), width = 0.5)
The default width value for errorbars is 0.9, that is 90% of the width of the bar.